Concepts
How dashboards read
A dashboard is a named page of widgets built over live queries against your items, workflows, forms, and time entries. Scroll through the moving parts, then dig into the reference below.
- Widgets
- Catalog
- Drill
- Access
Scroll
Everywhere else in AssureSwarm you change something. Dashboards are the one surface that only reads, which is what makes them safe to leave open all day and worth understanding as a layer of their own.
Configured widgets over live queries
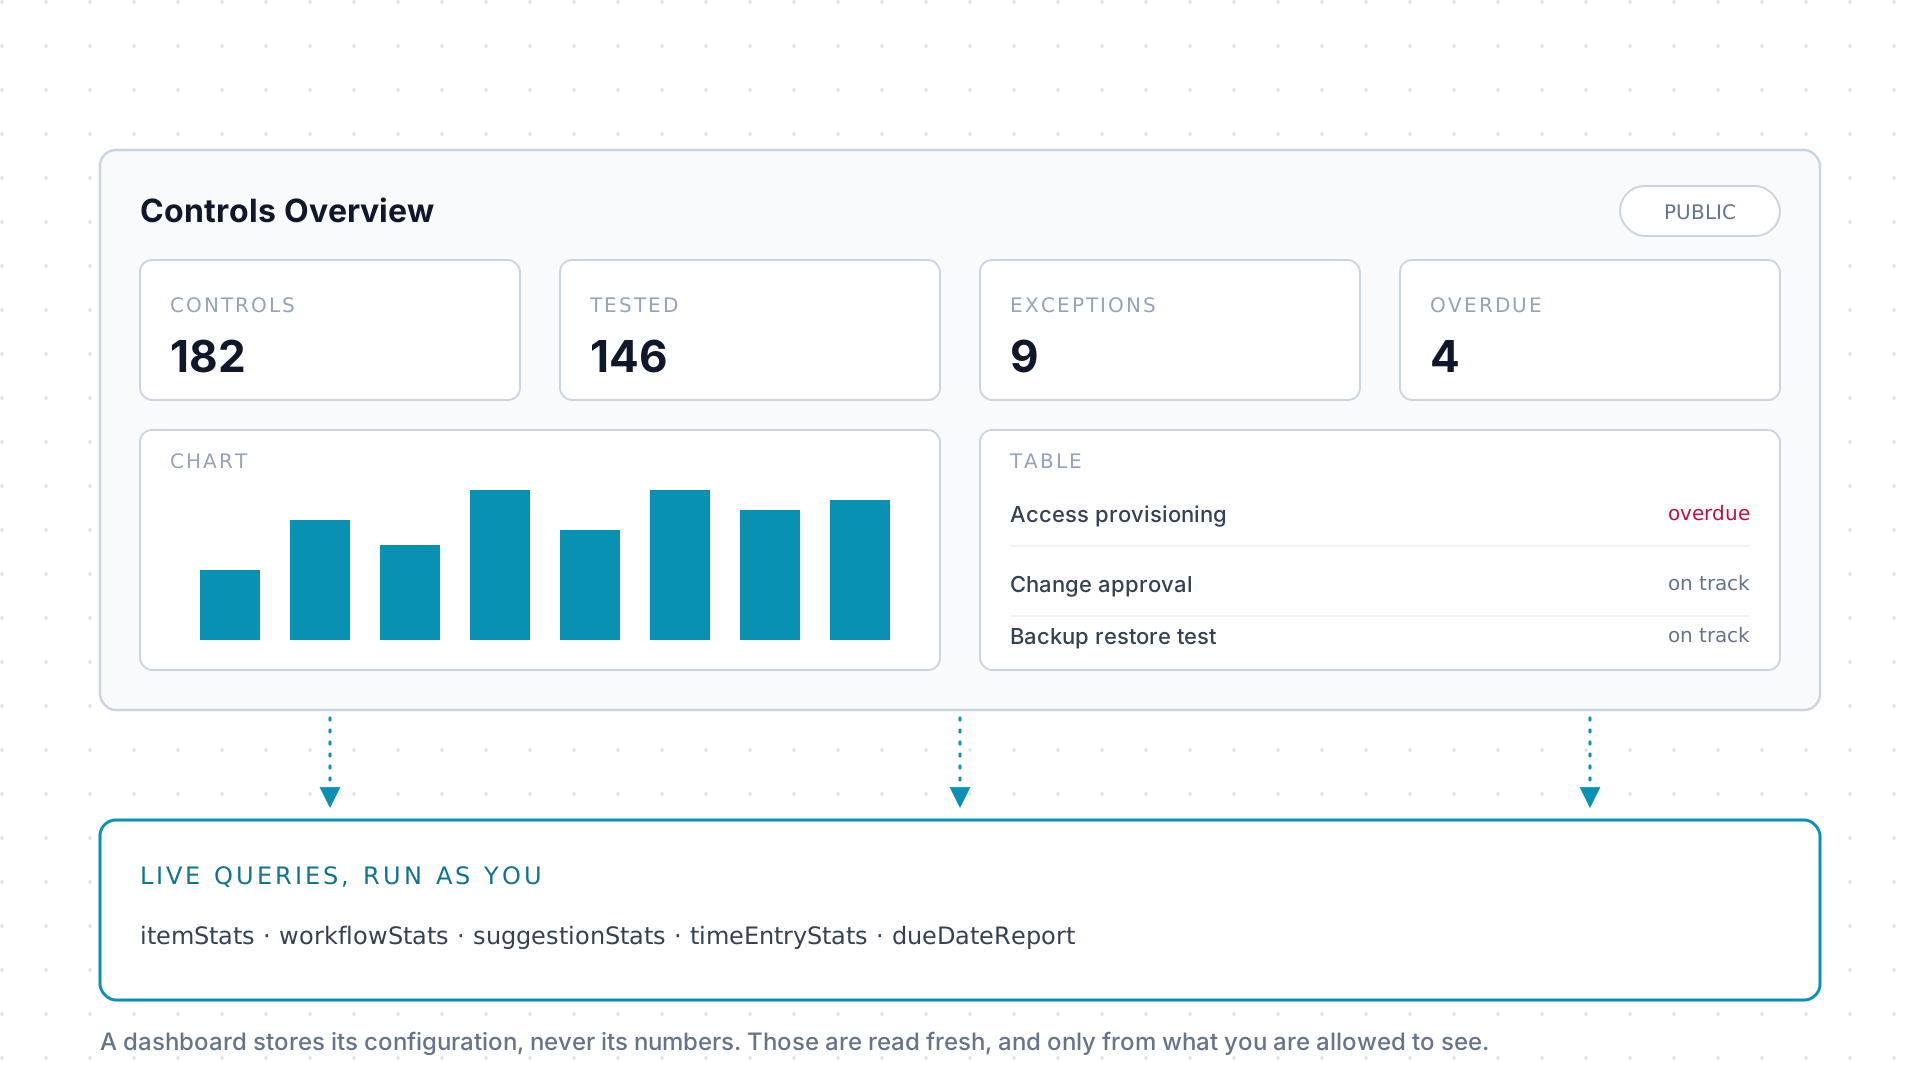
Section titled “Configured widgets over live queries”A dashboard has a name, a description, and a list of widgets: stat tiles, charts, tables, and filter bars. What it stores is the configuration, which query feeds each widget, how that query is filtered, how the result is styled. It never stores the numbers.
Those come from the same read-only query surface agents use, itemStats,
workflowStats, suggestionStats, timeEntryStats, dueDateReport, run
fresh each time the page loads and scoped to your own
permissions. Two people can open the same
dashboard and correctly see different totals.
Shipped, imported, or built here
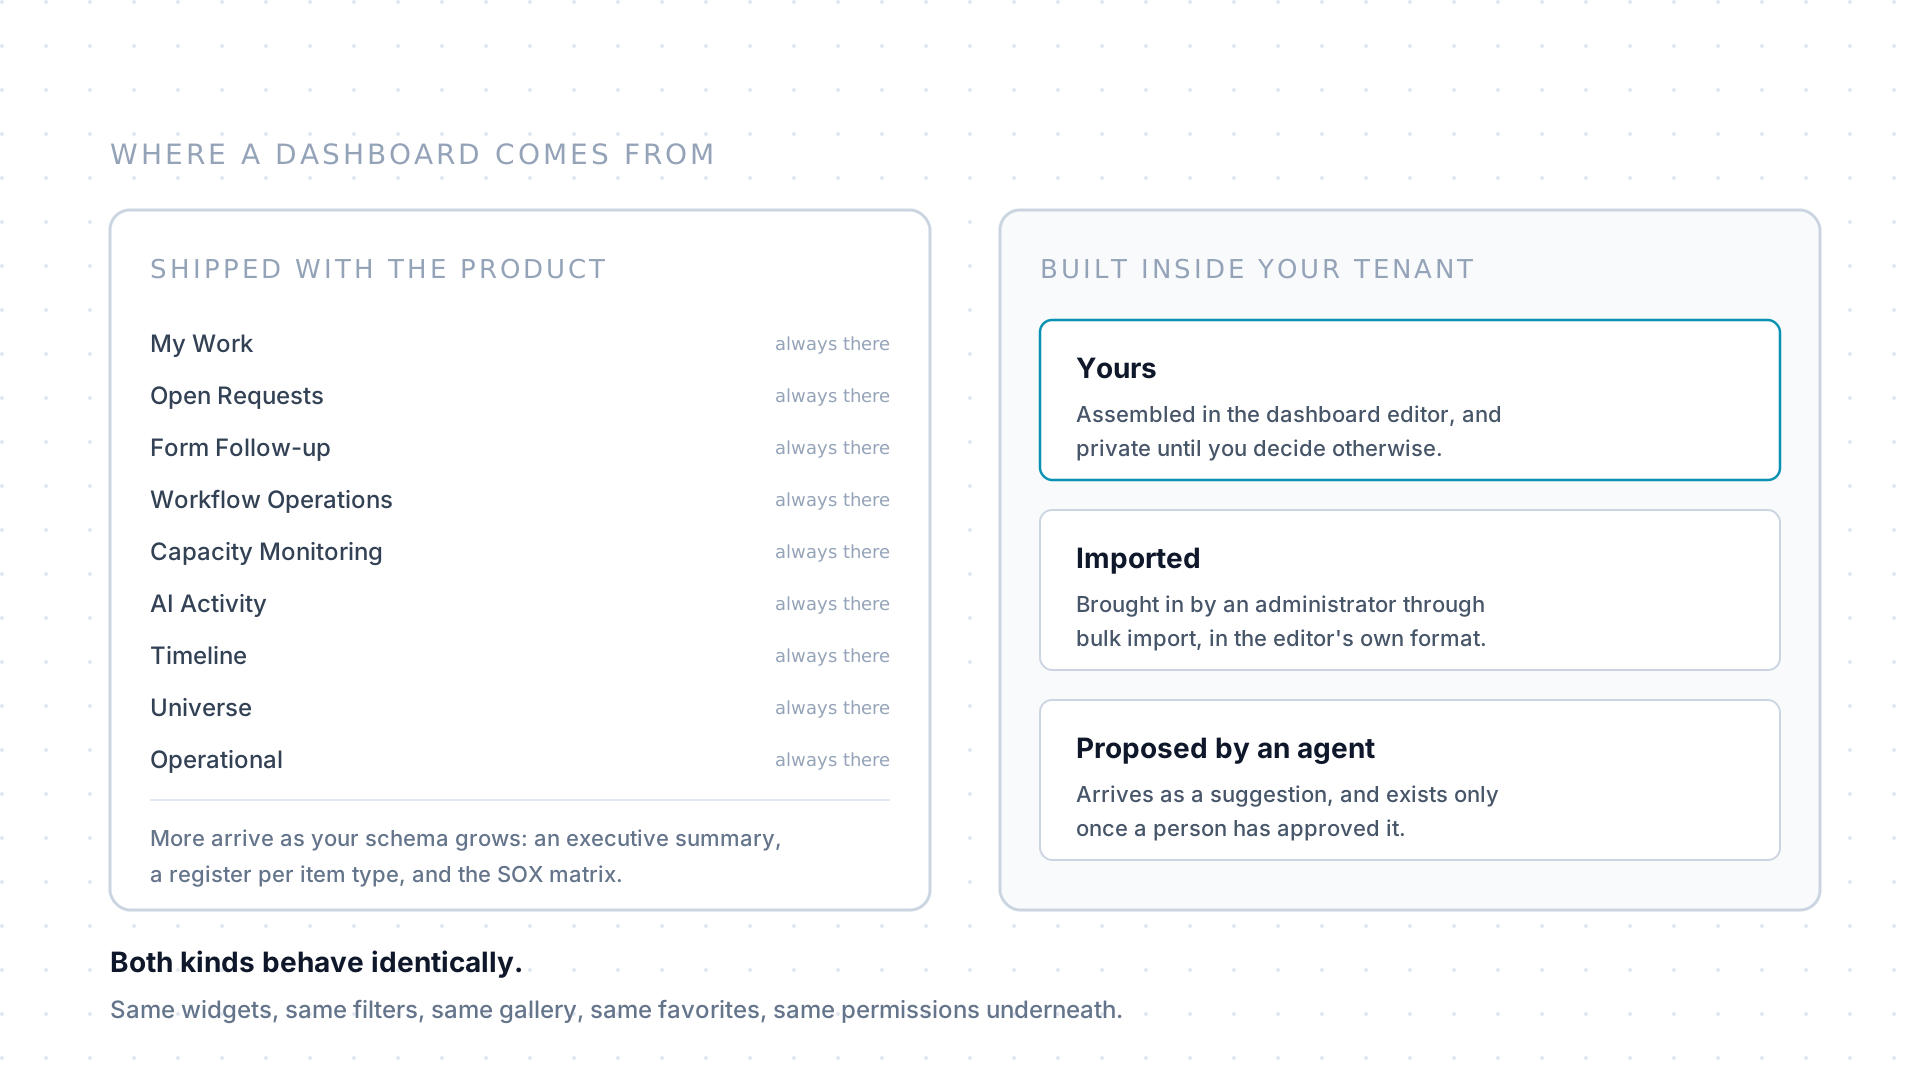
Section titled “Shipped, imported, or built here”Built-in dashboards cover personal work, workflow operations, capacity, forms, AI activity, processes, the risk control matrix, SOX and the item graph. Their availability follows the tenant’s installed dashboard rows and schema. An empty workflow portfolio shows an empty state.
More appear as your schema grows, because a register cannot exist before its item type does. On top of that, anyone can build their own in the editor, an administrator can import one, and an agent can propose one.
A number, then the rows behind it
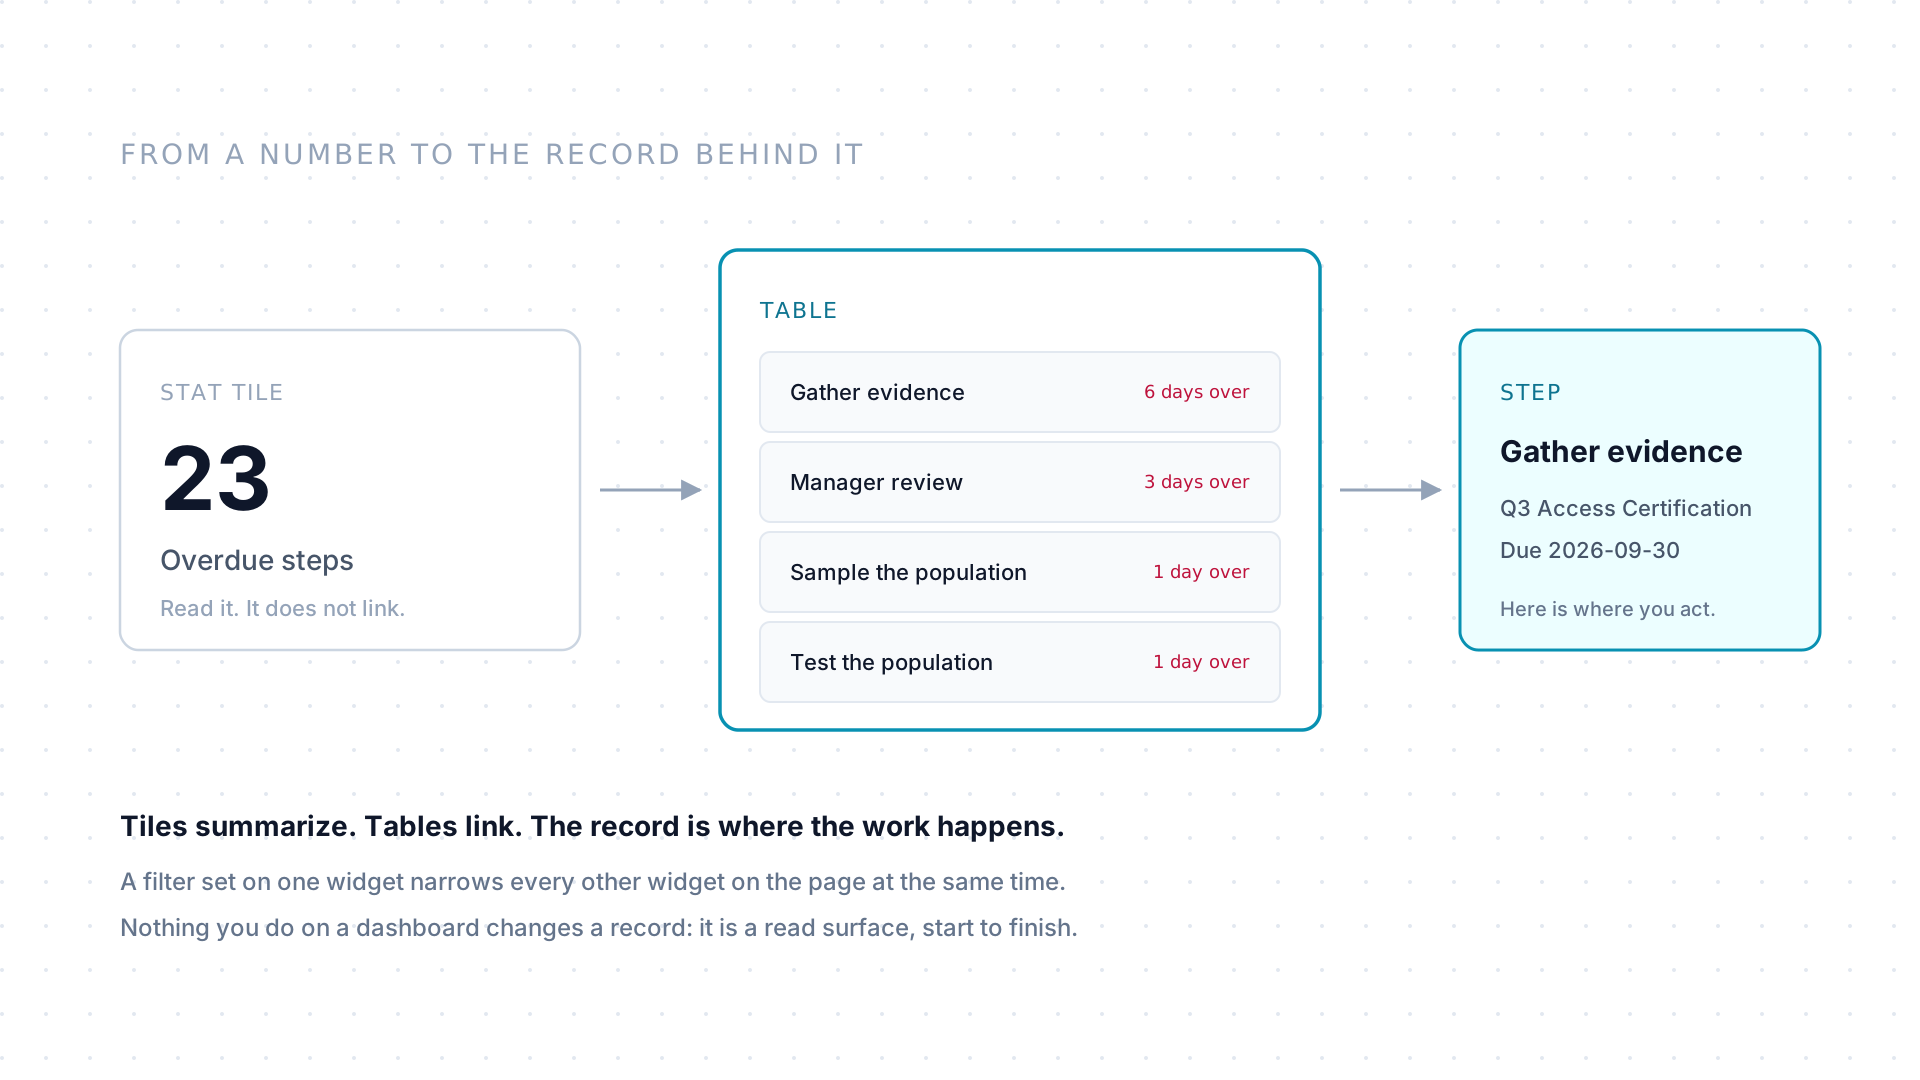
Section titled “A number, then the rows behind it”Tiles carry a number and nothing else: they are a summary, not a link. The tables underneath them are where a dashboard opens up, because a table row can carry you straight to the step, form, or record it stands for.
Filters work on the whole page rather than on the widget you set them on, so a dashboard that looks empty is often a filter left over from the last visit. Nothing on the page writes anything: to change something you follow the link through and work the record.
Private until you publish it
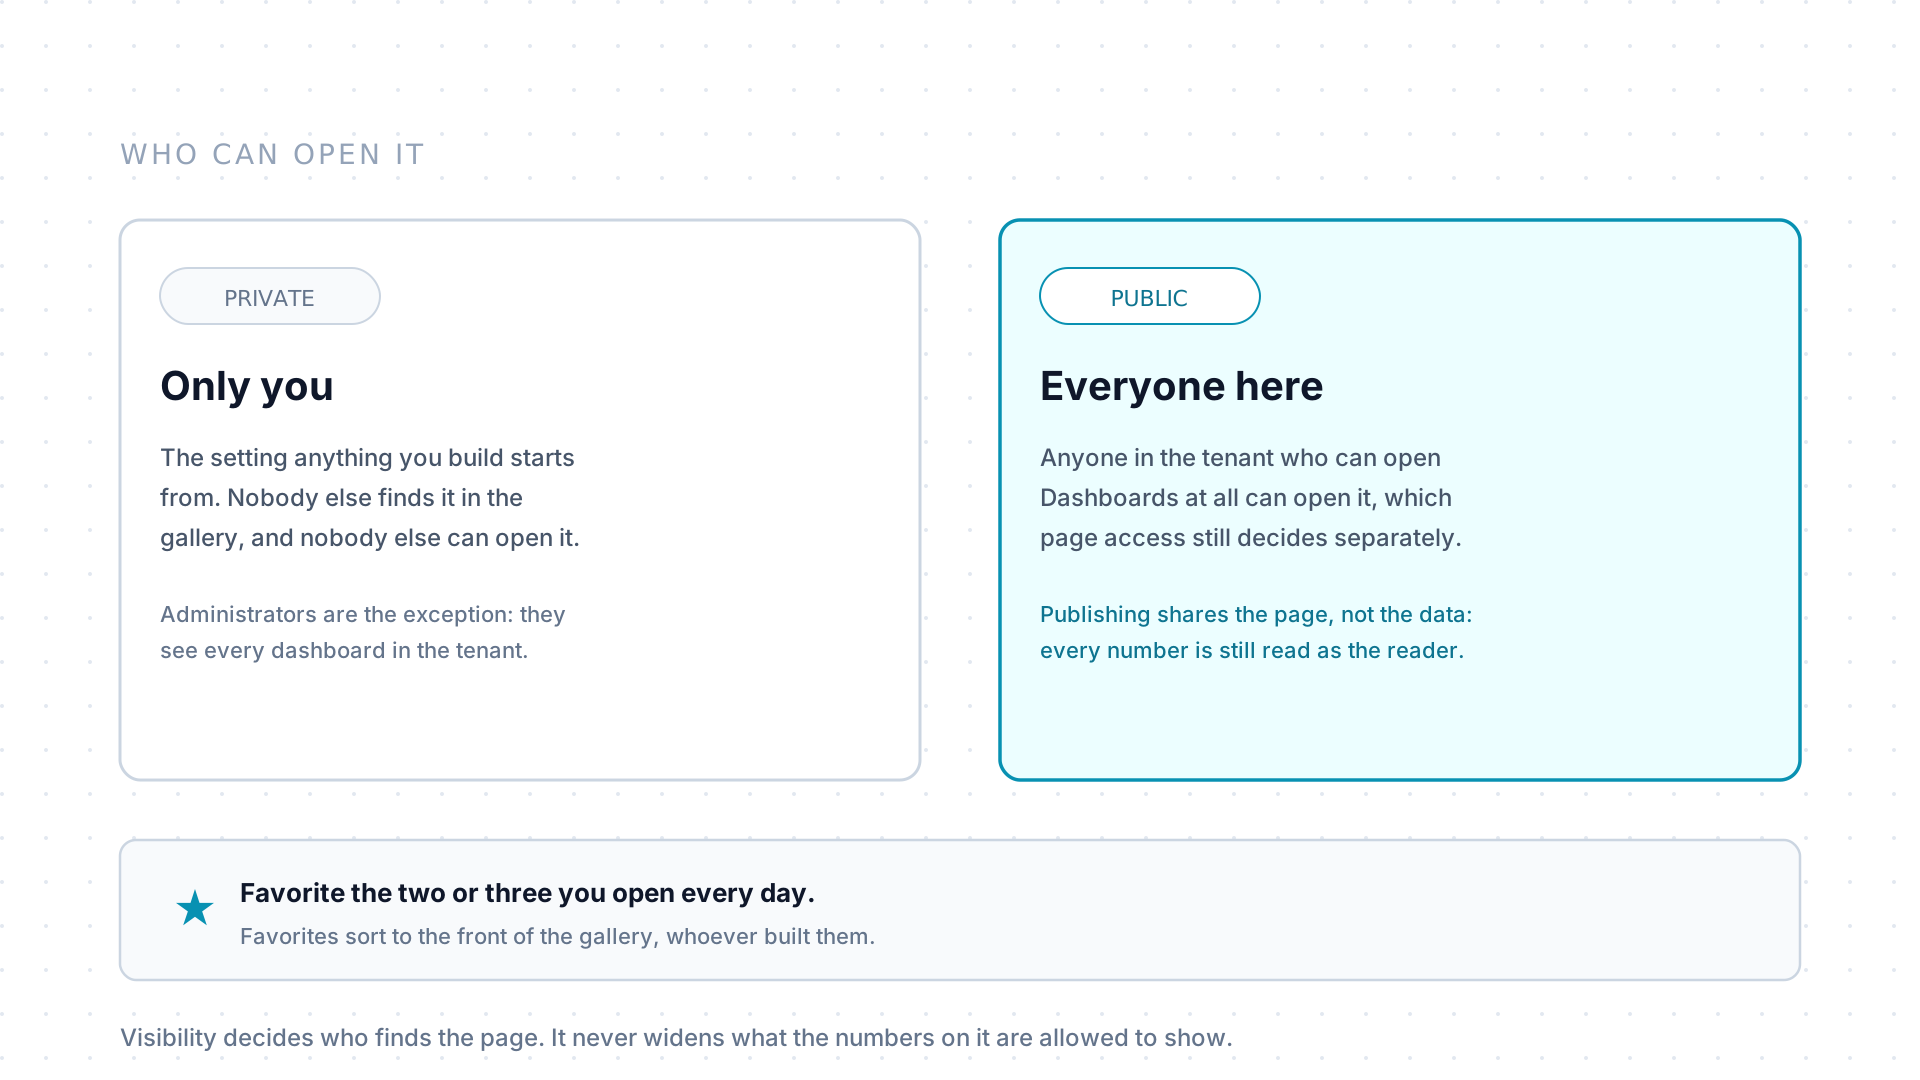
Section titled “Private until you publish it”A dashboard is PRIVATE when you create it, meaning you are the only person
who finds it in the gallery. Setting it to PUBLIC shares it with everyone
in the tenant who can open the Dashboards section at all, which
page access still decides separately.
Administrators are the exception on the private side: they see every
dashboard in the tenant.
Publishing shares the page, not the data. Every widget still runs as whoever is reading, so a colleague opening your dashboard sees their own numbers, not yours. Favorites sort to the front of the gallery, which is the fastest way to keep the two or three you actually use in reach.
Widgets
Section titled “Widgets”| Widget | What it shows |
|---|---|
| Chart | A bar, line, or pie chart. |
| Table | Rows of data, and the one widget that can link through to a record. |
| Stat card | A single number. |
| Stat row | A row of several numbers together. |
| Matrix | A grid crossing two dimensions, such as controls against testing steps. |
| Filter bar | One interactive filter that narrows the rest of the dashboard. |
| Multi-filter bar | Several interactive filters that narrow the rest of the dashboard. |
| Query selector | A control for switching which query a widget displays. |
| Markdown table aggregator | An aggregated table rendered from a markdown-based configuration. |
Data behind widgets
Section titled “Data behind widgets”Widgets are built on the same read-only query surface that agents use through
GraphQL: aggregate data like item counts and breakdowns
(itemStats), workflow and step progress (workflowStats), suggestion volume
and approval rate (suggestionStats), time summaries (timeEntryStats), due
and overdue reporting (dueDateReport), team workload (teamWorkloadStats),
and form completion status. Configuring a widget, which query feeds it, how it
is filtered, how it is styled, happens in the dashboard editor, and the same
configuration can be brought into a tenant through
bulk import.
Built-in views
Section titled “Built-in views”Every tenant ships with a set of built-in dashboards, reachable from the Dashboards page in the top navigation. They behave like any other dashboard: you can favorite them, and they respect the same filters.
Availability depends on the dashboard rows installed in your tenant and its
schema. The six register views require their item type; Executive requires at
least one of those types. Other installed views remain listed even when their
data is empty. The dashboardTypes query returns the current catalog.
| Dashboard | What it shows | When it is listed |
|---|---|---|
Executive (/dashboards/executive) |
Enterprise assurance posture and decisions | once any register item type is active |
Operational (/dashboards/operations) |
Workflow throughput, delay, and accumulated work | always |
My Work (/dashboards/my-work) |
A prioritized view of work requiring action | always |
Workflow Operations (/dashboards/workflow-operations) |
Running workflows, stage delay, and cycle time | always |
Processes (/dashboards/processes) |
Process structure, workflow templates, usage, and control/risk coverage | always |
Capacity Monitoring (/dashboards/capacity-monitoring) |
Owner workload, due work, and late work | always |
AI Activity (/dashboards/ai-activity) |
Suggestion usage and outcome movement | always |
Form Follow-up (/dashboards/form-follow-up) |
Sent forms, aging, and recipient response | always |
Control Library (/dashboards/controls) |
Coverage, effectiveness, and control exceptions | once the control item type is active |
Risk Register (/dashboards/risks) |
Exposure, appetite, and risk movement | once the risk item type is active |
Issues (/dashboards/issues) |
Remediation age, deadlines, and ownership | once the issue item type is active |
Audits (/dashboards/audits) |
Plan progress and engagement intervention | once the audit item type is active |
Policies (/dashboards/policies) |
Policy currency and review coverage | once the policy item type is active |
Systems (/dashboards/systems) |
System criticality and assurance currency | once the system item type is active |
Risk Control Matrix (RCM) (/dashboards/rcm) |
Audit fieldwork coverage of controls and the risks they mitigate | always |
SOX Program (/dashboards/sox-program) |
Scoping, testing, deficiencies, and PBC readiness | always |
Universe (/dashboards/universe) |
Interactive graph of items, templates, runs and steps and how they connect; ego and path focus modes | always |
Using dashboards is the procedure for working with them, and Exploring the universe covers the graph view in particular.
Sharing and visibility
Section titled “Sharing and visibility”Each dashboard has a name and a description, plus a visibility setting:
PRIVATE, where only you and administrators can see it, or PUBLIC, where
everyone in the tenant can. New dashboards start PRIVATE. You can favorite the
ones you use often so they sort to the front of the gallery.
Visibility governs who finds the page. It does not govern what the page shows: every widget query runs as the person reading it, so publishing a dashboard never exposes a record the reader could not already open.
Importing and agent-created dashboards
Section titled “Importing and agent-created dashboards”Administrators can bring dashboards into a tenant through bulk import, in the same format the dashboard editor produces. Agents can also propose a new dashboard through suggest_change; like any suggestion it exists only once a person reviews and approves it. See Suggestions for how that review flow works.