Using AssureSwarm · Guide
Exploring the universe
Every record you hold and every link between them, drawn as one map you can filter, inspect, and replay. Scroll, and learn to read it.
- Graph
- Filter
- Inspect
- Replay
Scroll
Registers answer questions about one item type. The Universe answers the question no register can: how all of it hangs together. It is a built-in dashboard, reached from the Dashboards gallery.
Everything, connected
Section titled “Everything, connected”The canvas draws one node per record and one line per relationship between
them, laid out by a force simulation so connected things settle near each
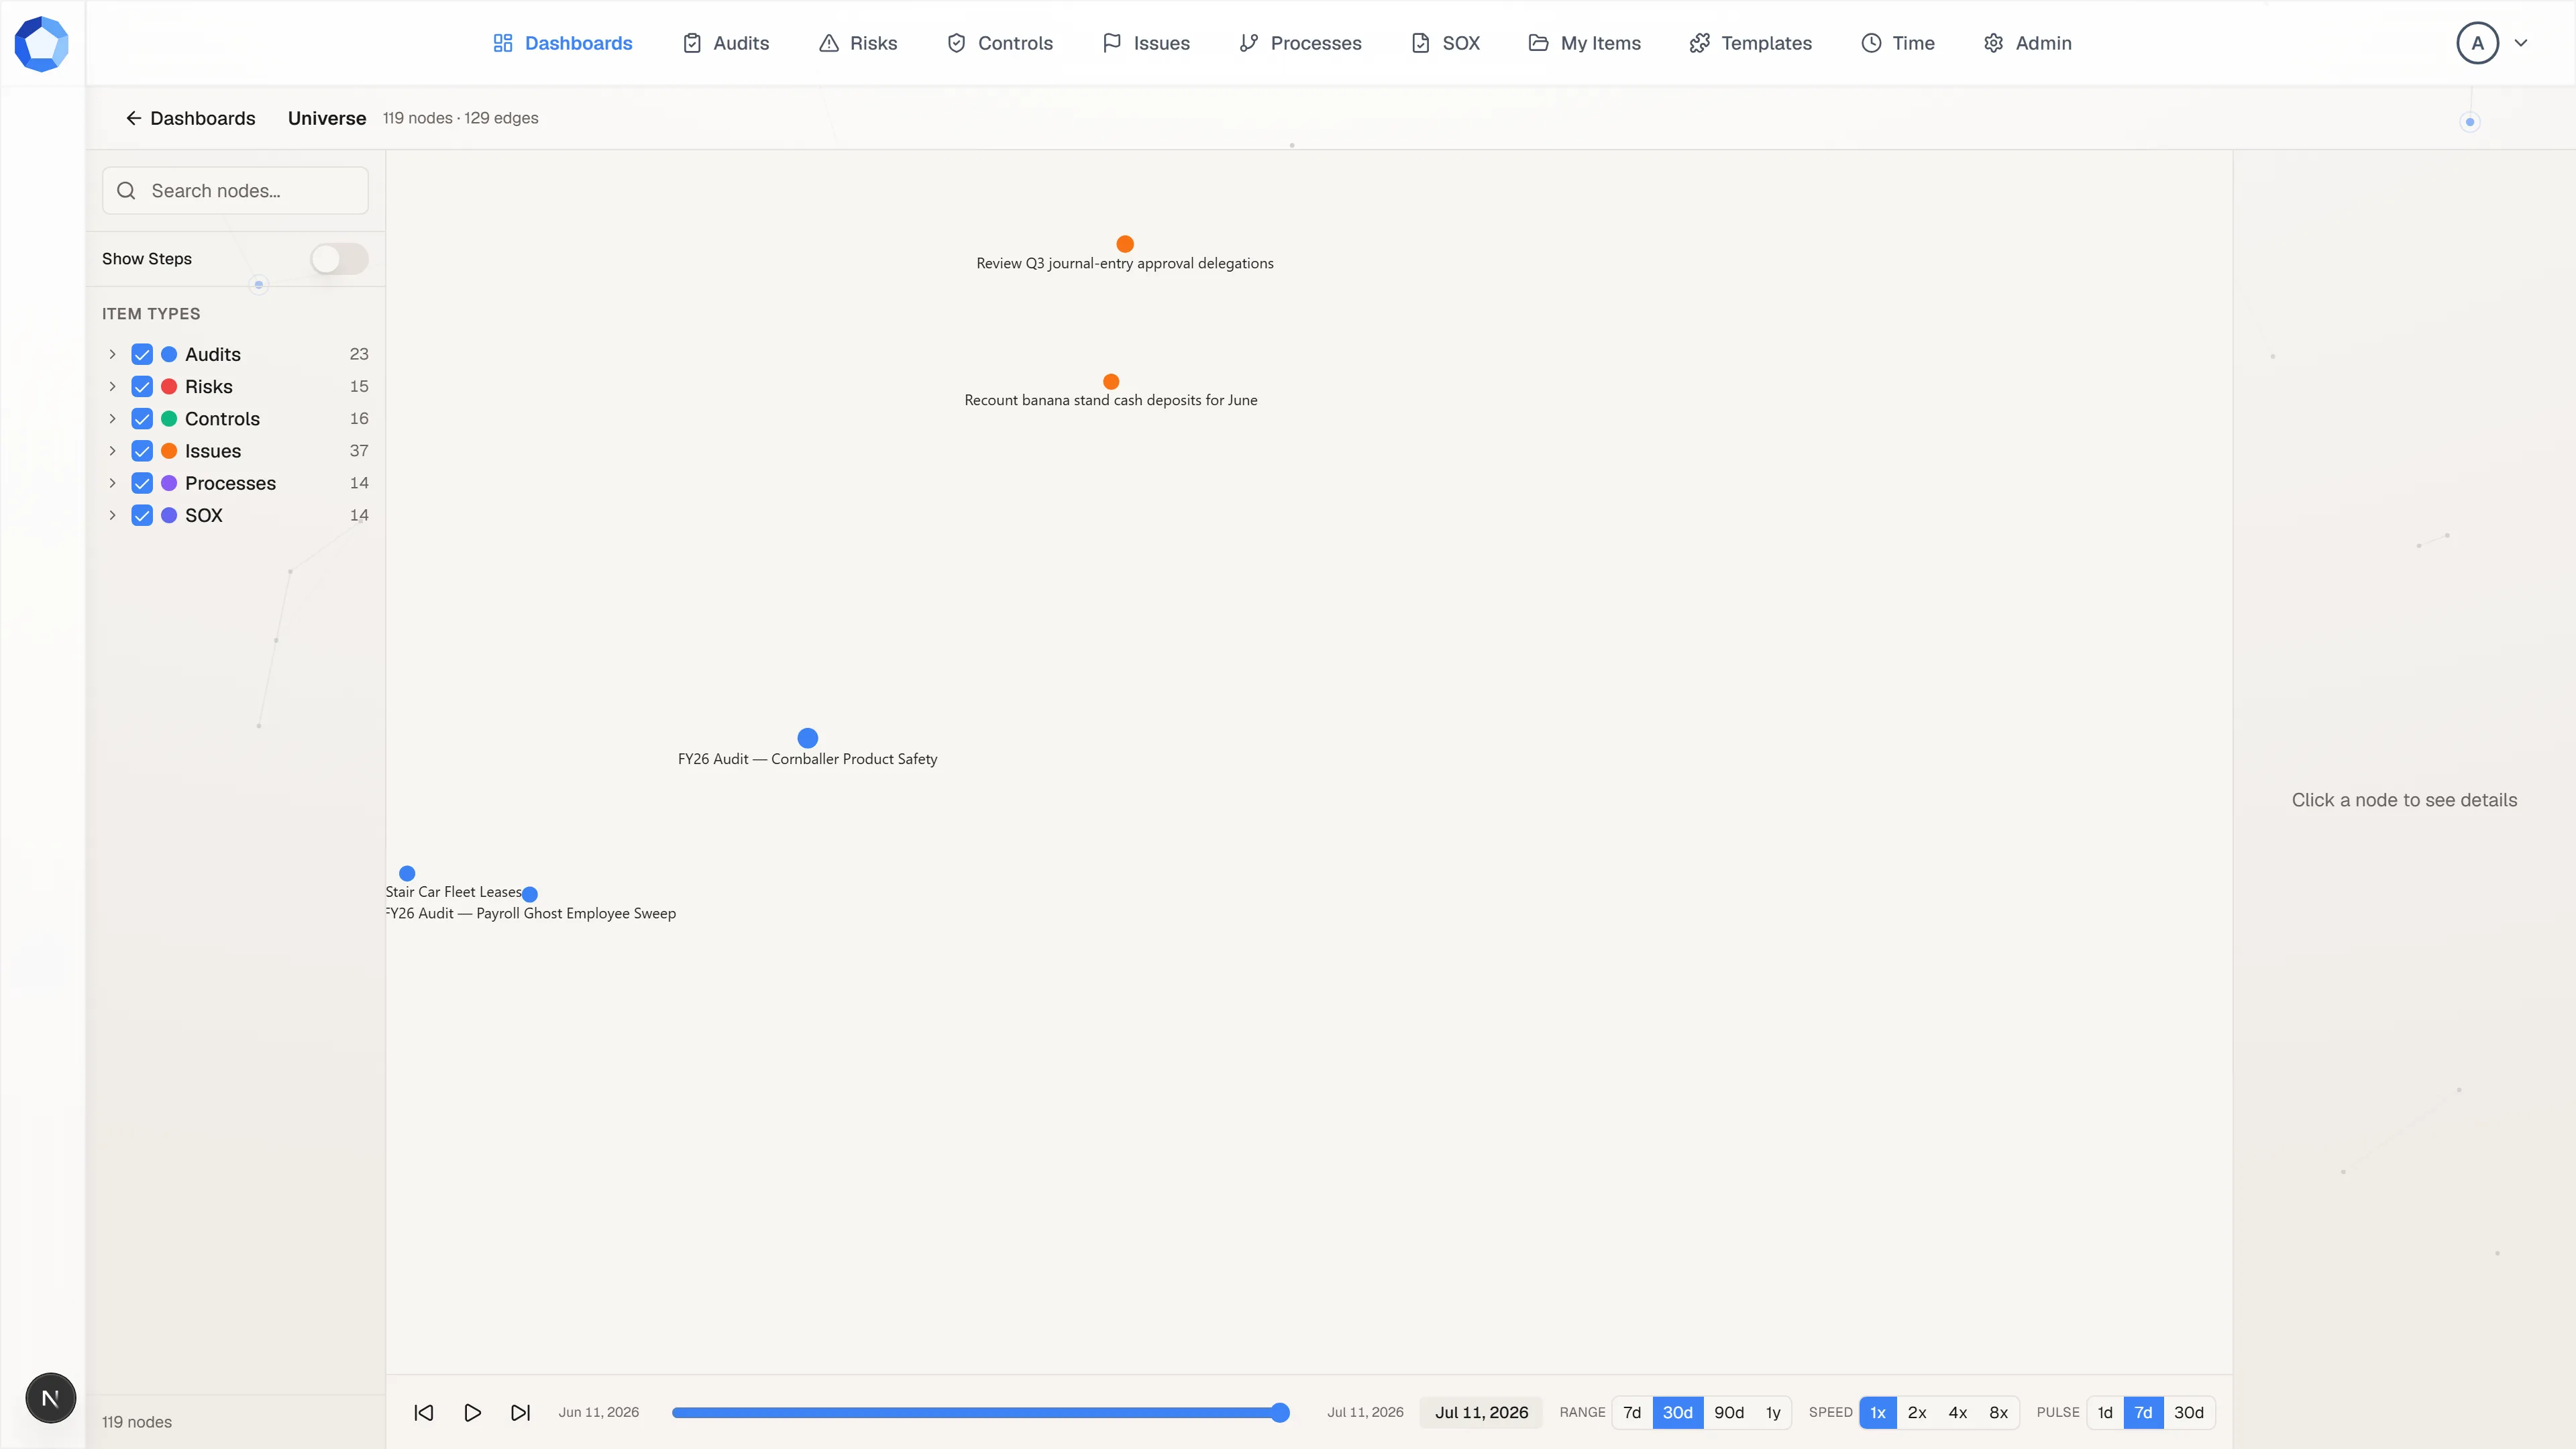
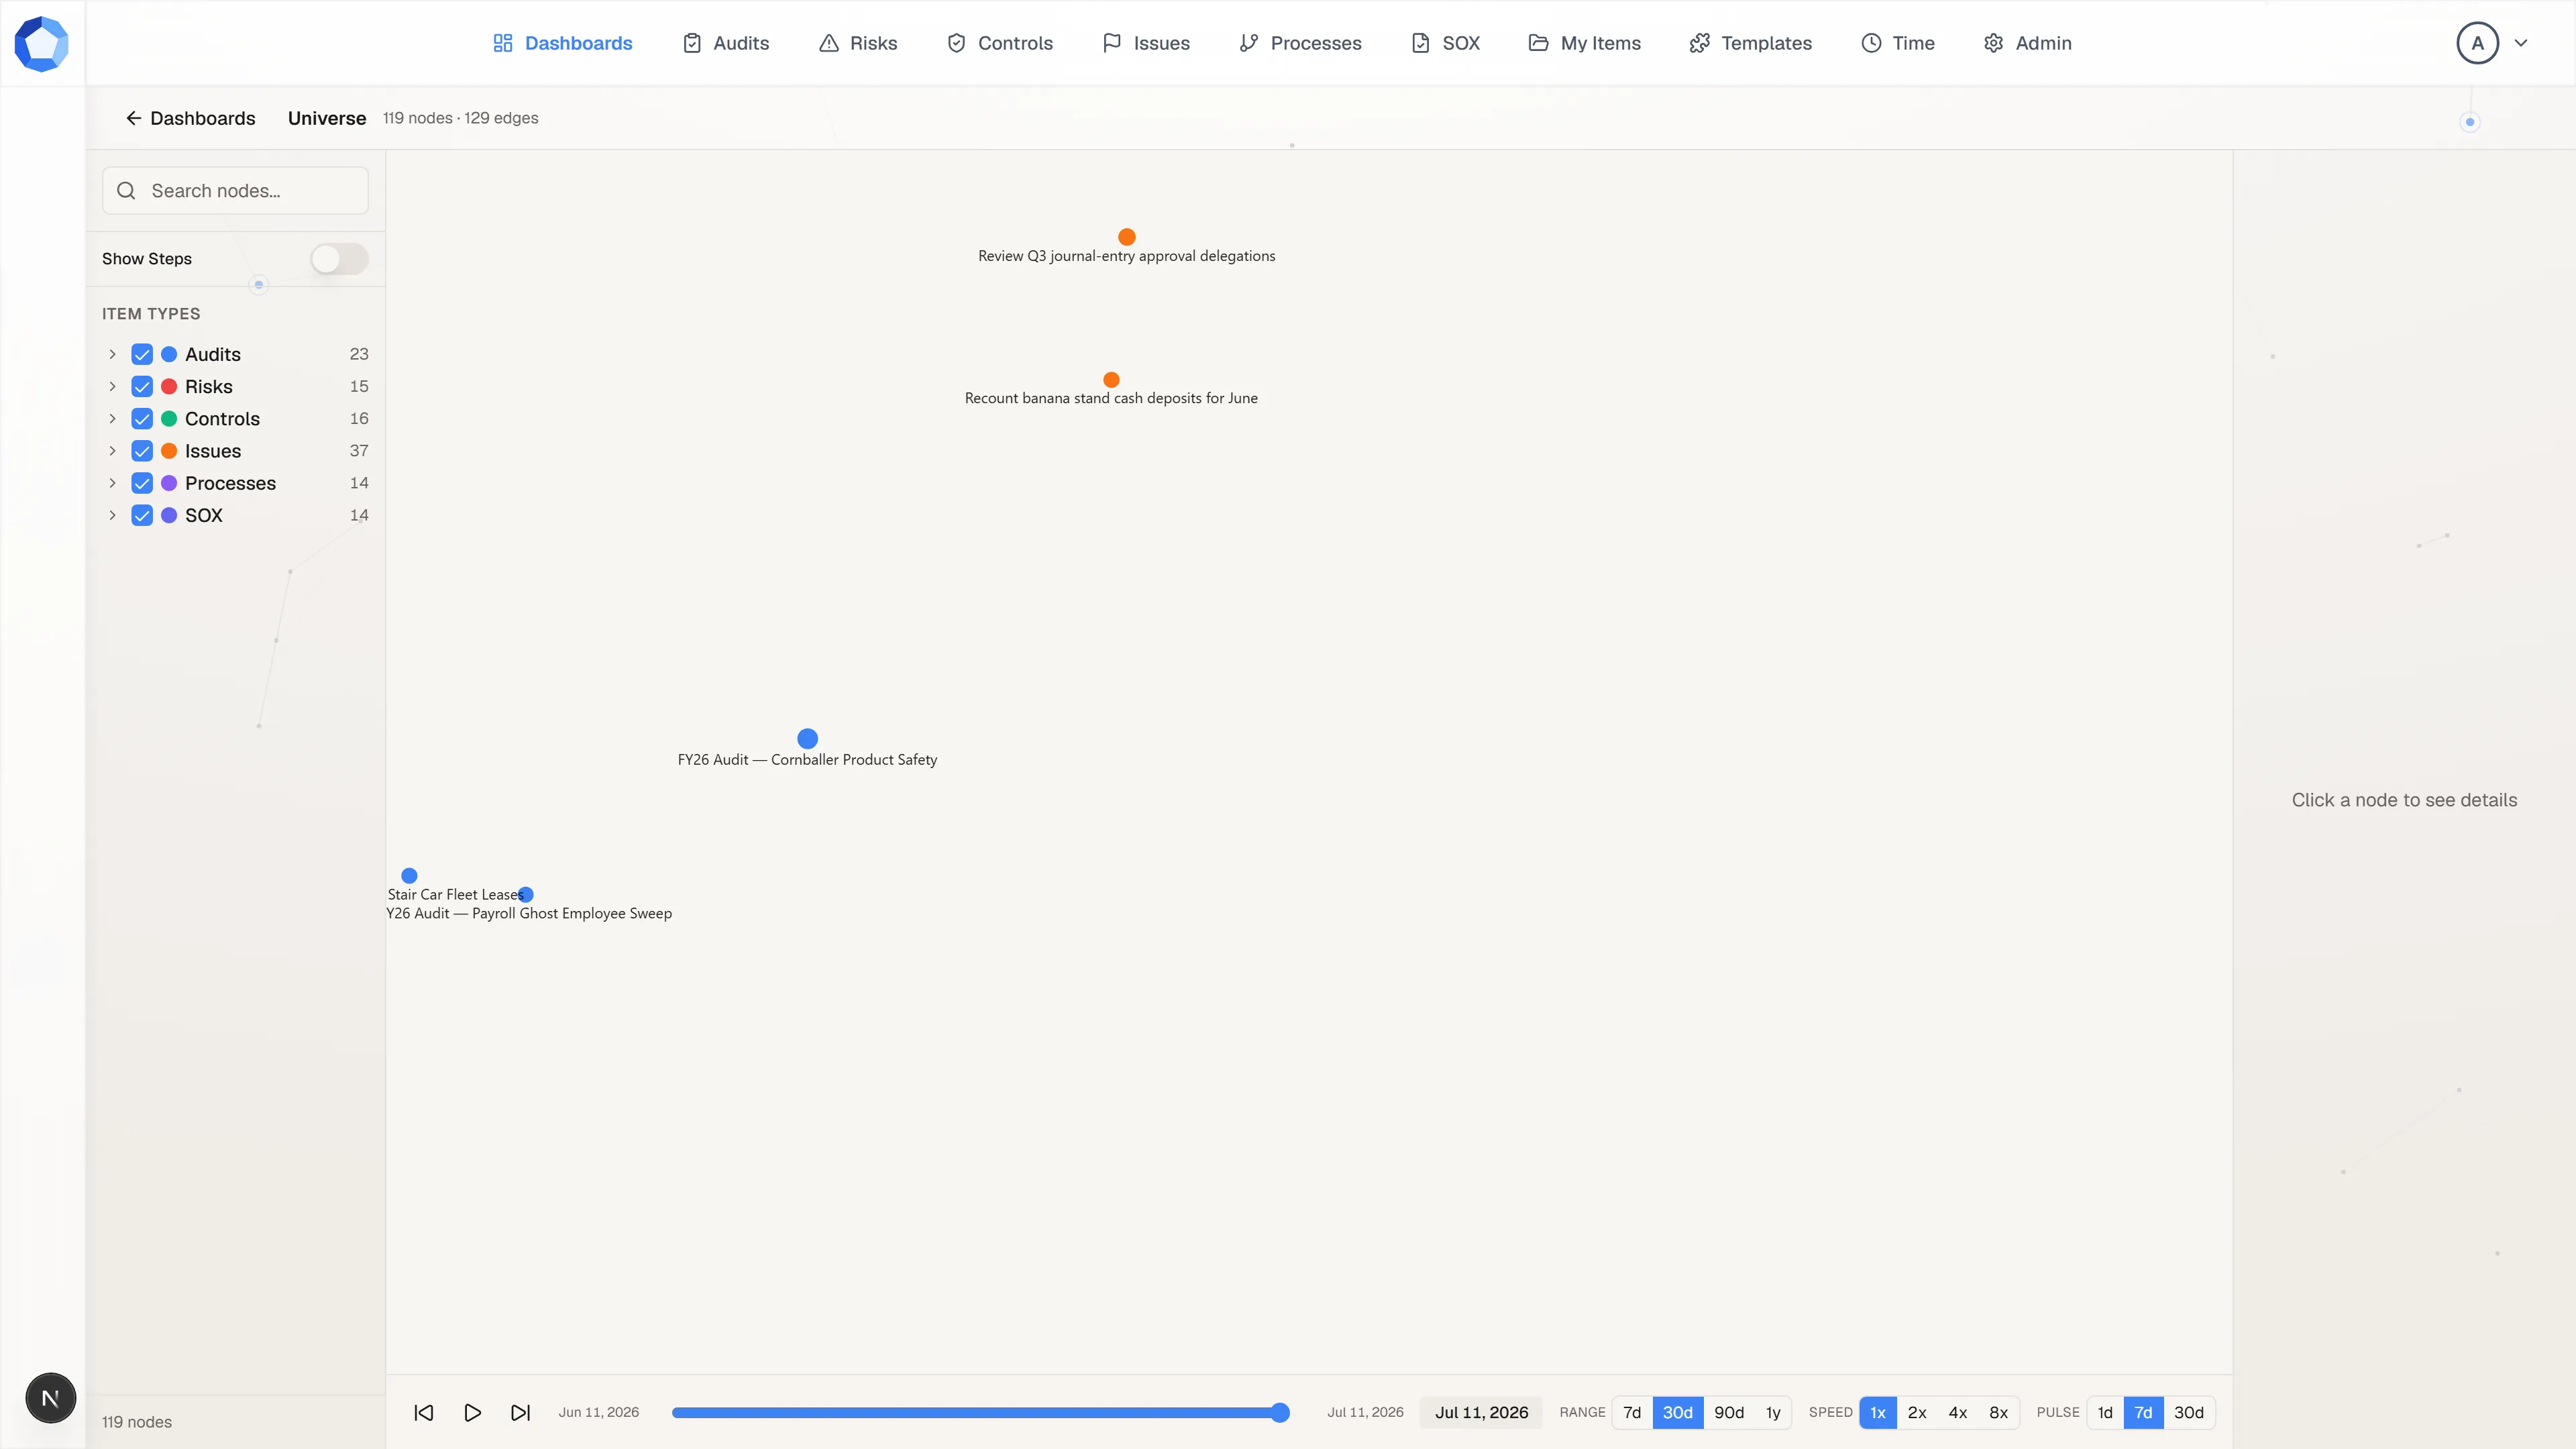
other. The header counts what you are looking at, such as 119 nodes and
129 edges, and node colors match the item types they come from.
Drag the background to pan, scroll to zoom, and drag a node to pull its neighborhood with it. Dense knots are the records everything else depends on, and a node sitting alone is one nobody has linked yet.
Carve it down
Section titled “Carve it down”A full tenant is too much to read at once, so the sidebar on the left cuts it down. Item Types lists each type with a color dot, its name, and how many nodes it contributes; clear a checkbox to drop that type off the map. Expand a type to filter it further by the values of its own fields.
Search nodes at the top narrows to records matching a name, and the Show Steps switch adds workflow steps to the graph so you can see which work touches which records.
Inspect one node
Section titled “Inspect one node”The panel down the right waits with Click a node to see details. Select any node and it fills with that record: its title as a link through to the record itself, the item type it belongs to, and its connections grouped by relationship, with the direction of each one.
Those connections are selectable too, so you can walk the graph one hop at a time from the panel instead of hunting for lines on the canvas.
Replay the activity
Section titled “Replay the activity”The bar along the bottom turns the map into a recording. Drag the scrubber to move the map to a moment in time, or press play to run the window forward: nodes swell as activity lands on them and settle back as it ages.
Range sets the window, from 7d out to 1y. Speed runs the replay
from 1x to 8x. Pulse sets how long a node stays swollen after
something happens to it, so a short pulse shows a sharp burst of work and a
long one shows sustained attention.
Reading the map
Section titled “Reading the map”- Clusters are shared dependencies: a control every audit tests, a system every issue traces back to. If a cluster is denser than you expected, that is concentration risk you can see rather than infer.
- Bridges, single links joining two otherwise separate groups, are the records whose accuracy matters most, because everything downstream reads through them.
- Isolated nodes are records nobody has related to anything. Sometimes that is correct. Often it means a relationship was never recorded.
When to use it, and when not to
Section titled “When to use it, and when not to”Use the Universe when the question is about connection: what this control touches, what an audit would drag in with it, whether a risk is covered anywhere. Use a register or a dashboard when the question is about a list, a count, or a status, because a table answers those far faster than a graph does.
The map shows only what you are allowed to see. Records your page and item access does not reach are absent from the graph, not greyed out, so two colleagues can see legitimately different maps.