Using AssureSwarm · Guide
Using dashboards
Dashboards are the read surface over everything your tenant holds: your own queue, work in flight, and what the agents have been proposing. Scroll, and go from the gallery to the record behind a number.
- Gallery
- Read
- Drill
- Monitor
Scroll
A dashboard is a page of widgets, charts, tables, and stat tiles, built over live queries against your items, workflows, forms, and time entries. Dashboards covers the widget model; this page is how to actually use them.
Find one in the gallery
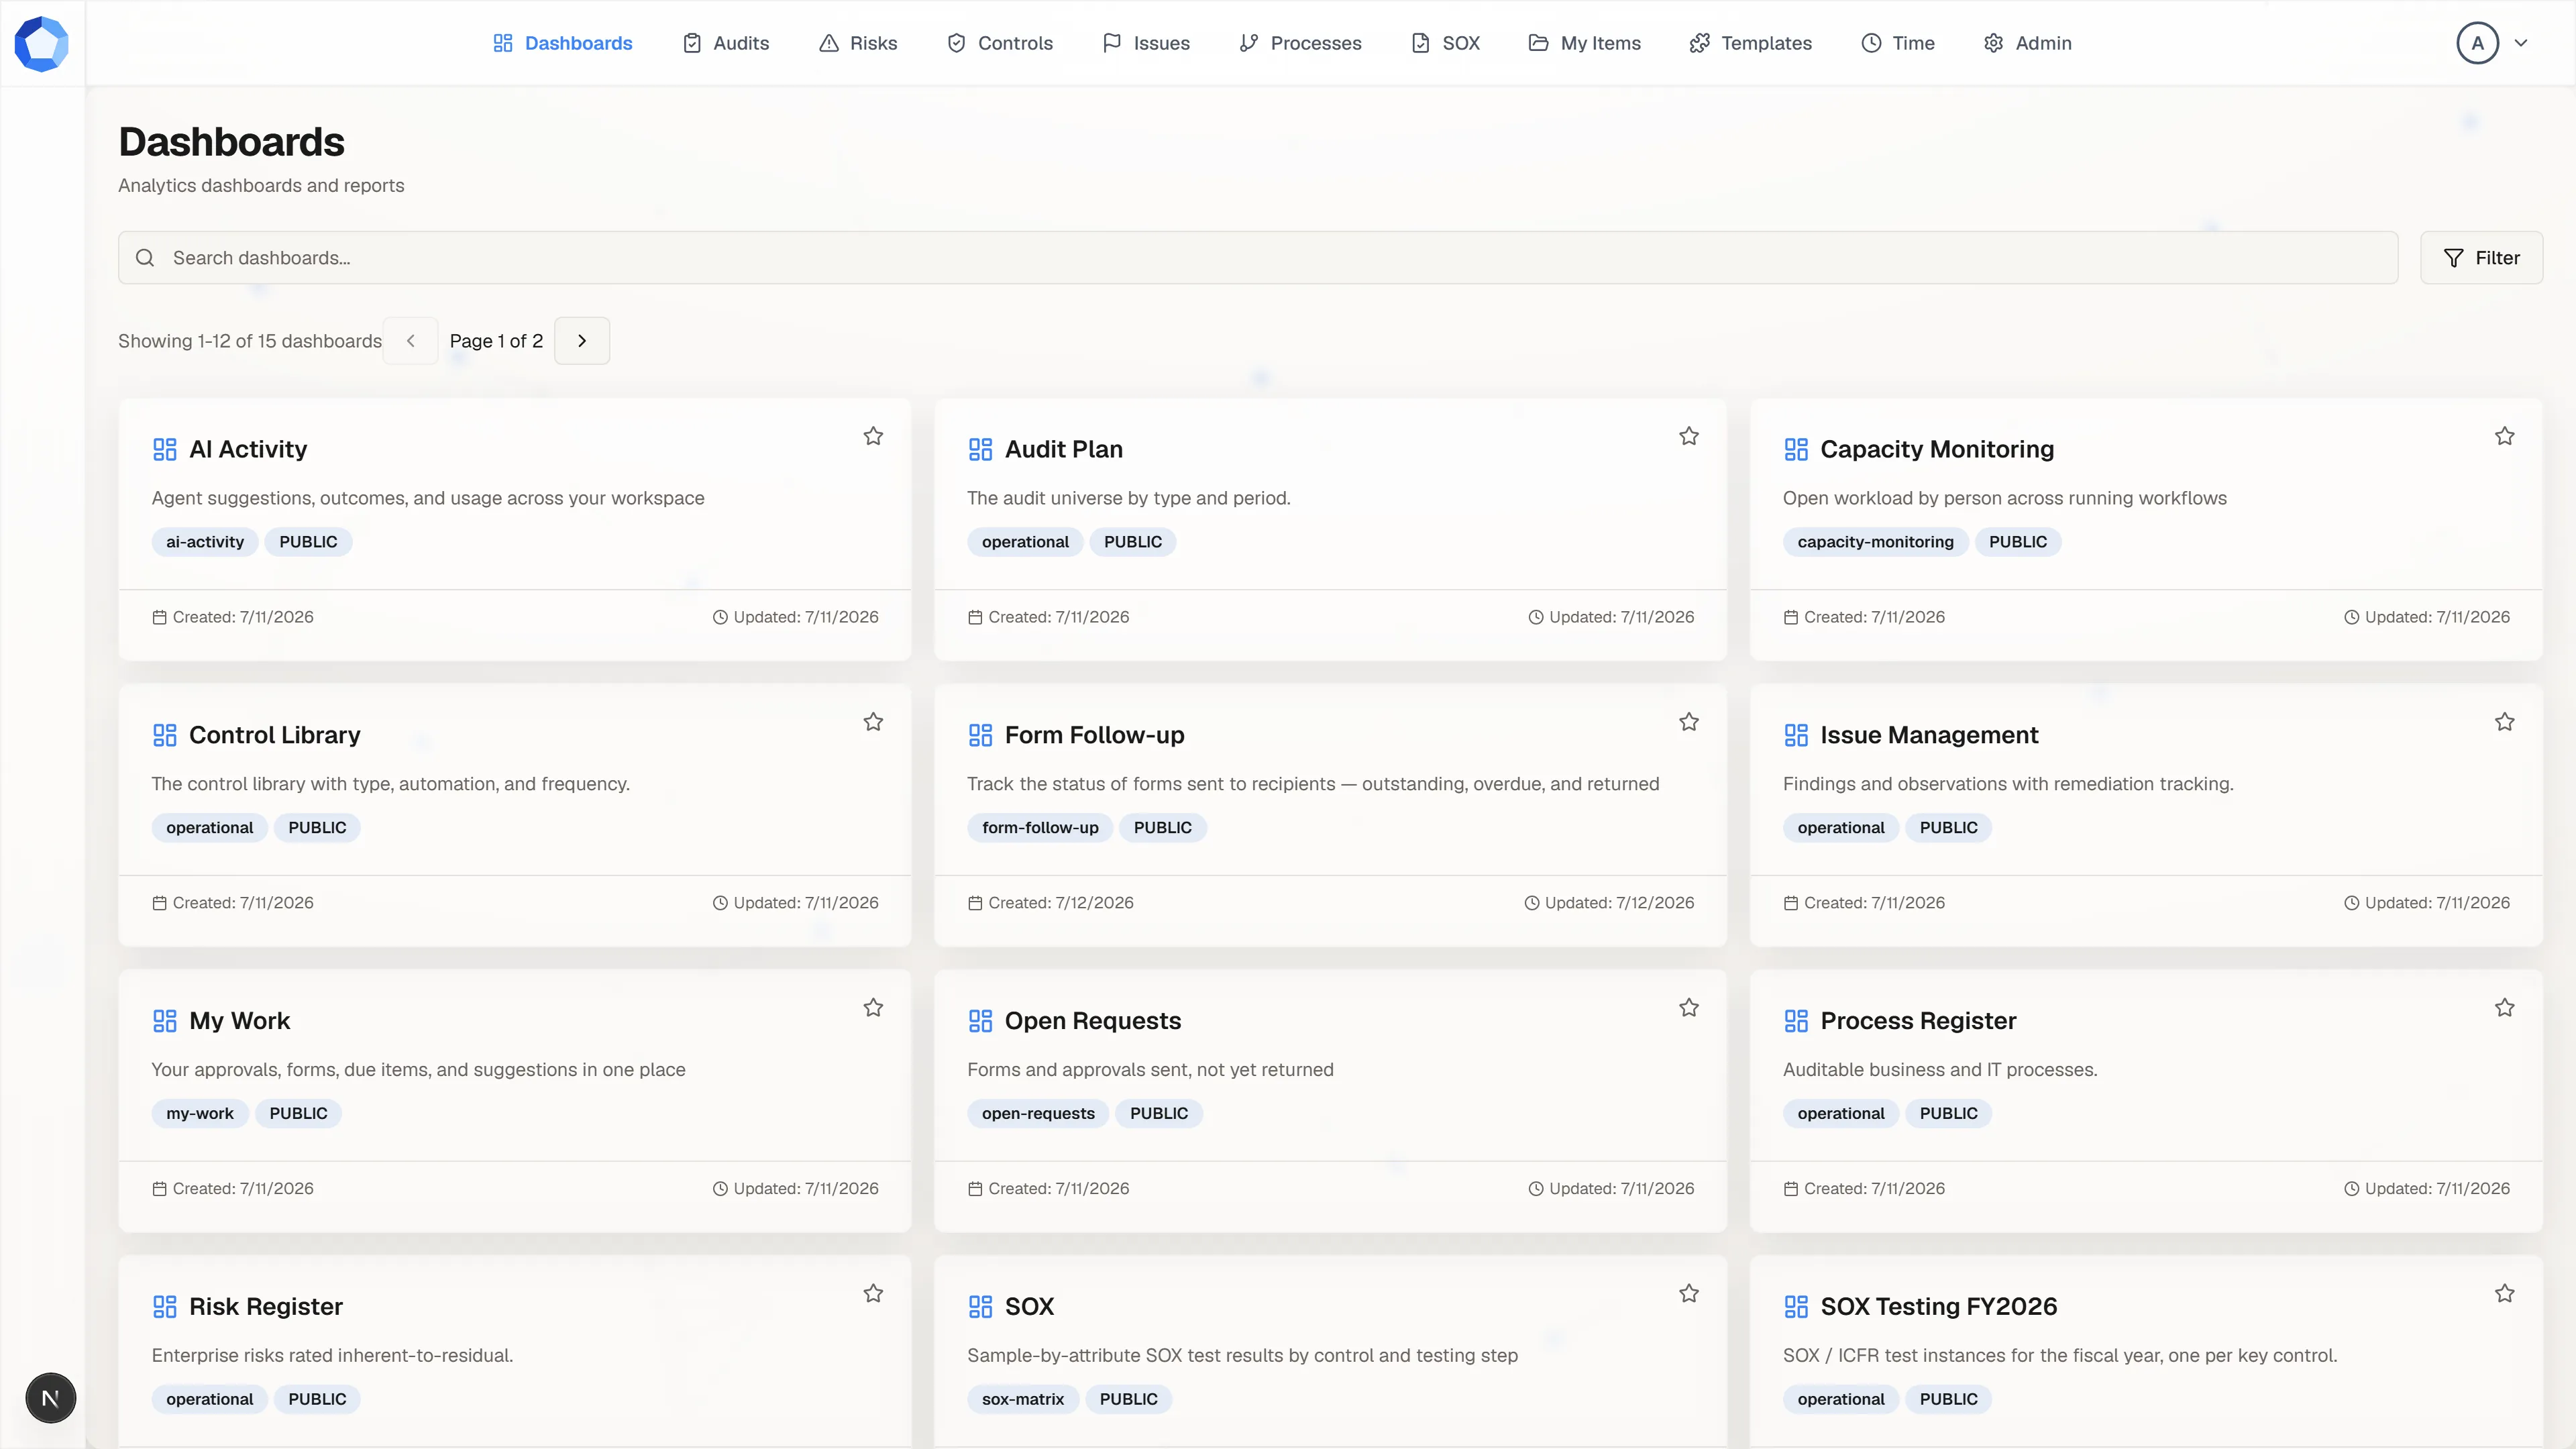
Section titled “Find one in the gallery”Dashboards in the top navigation opens the gallery: one card per
dashboard, each showing its description, its tags, and whether it is
PUBLIC or PRIVATE. Search narrows by name, and Filter narrows by
type and by visibility.
Dashboards you have favorited sort to the front, so the star on a card is worth using on the two or three you open every day.
Read the numbers, then the list
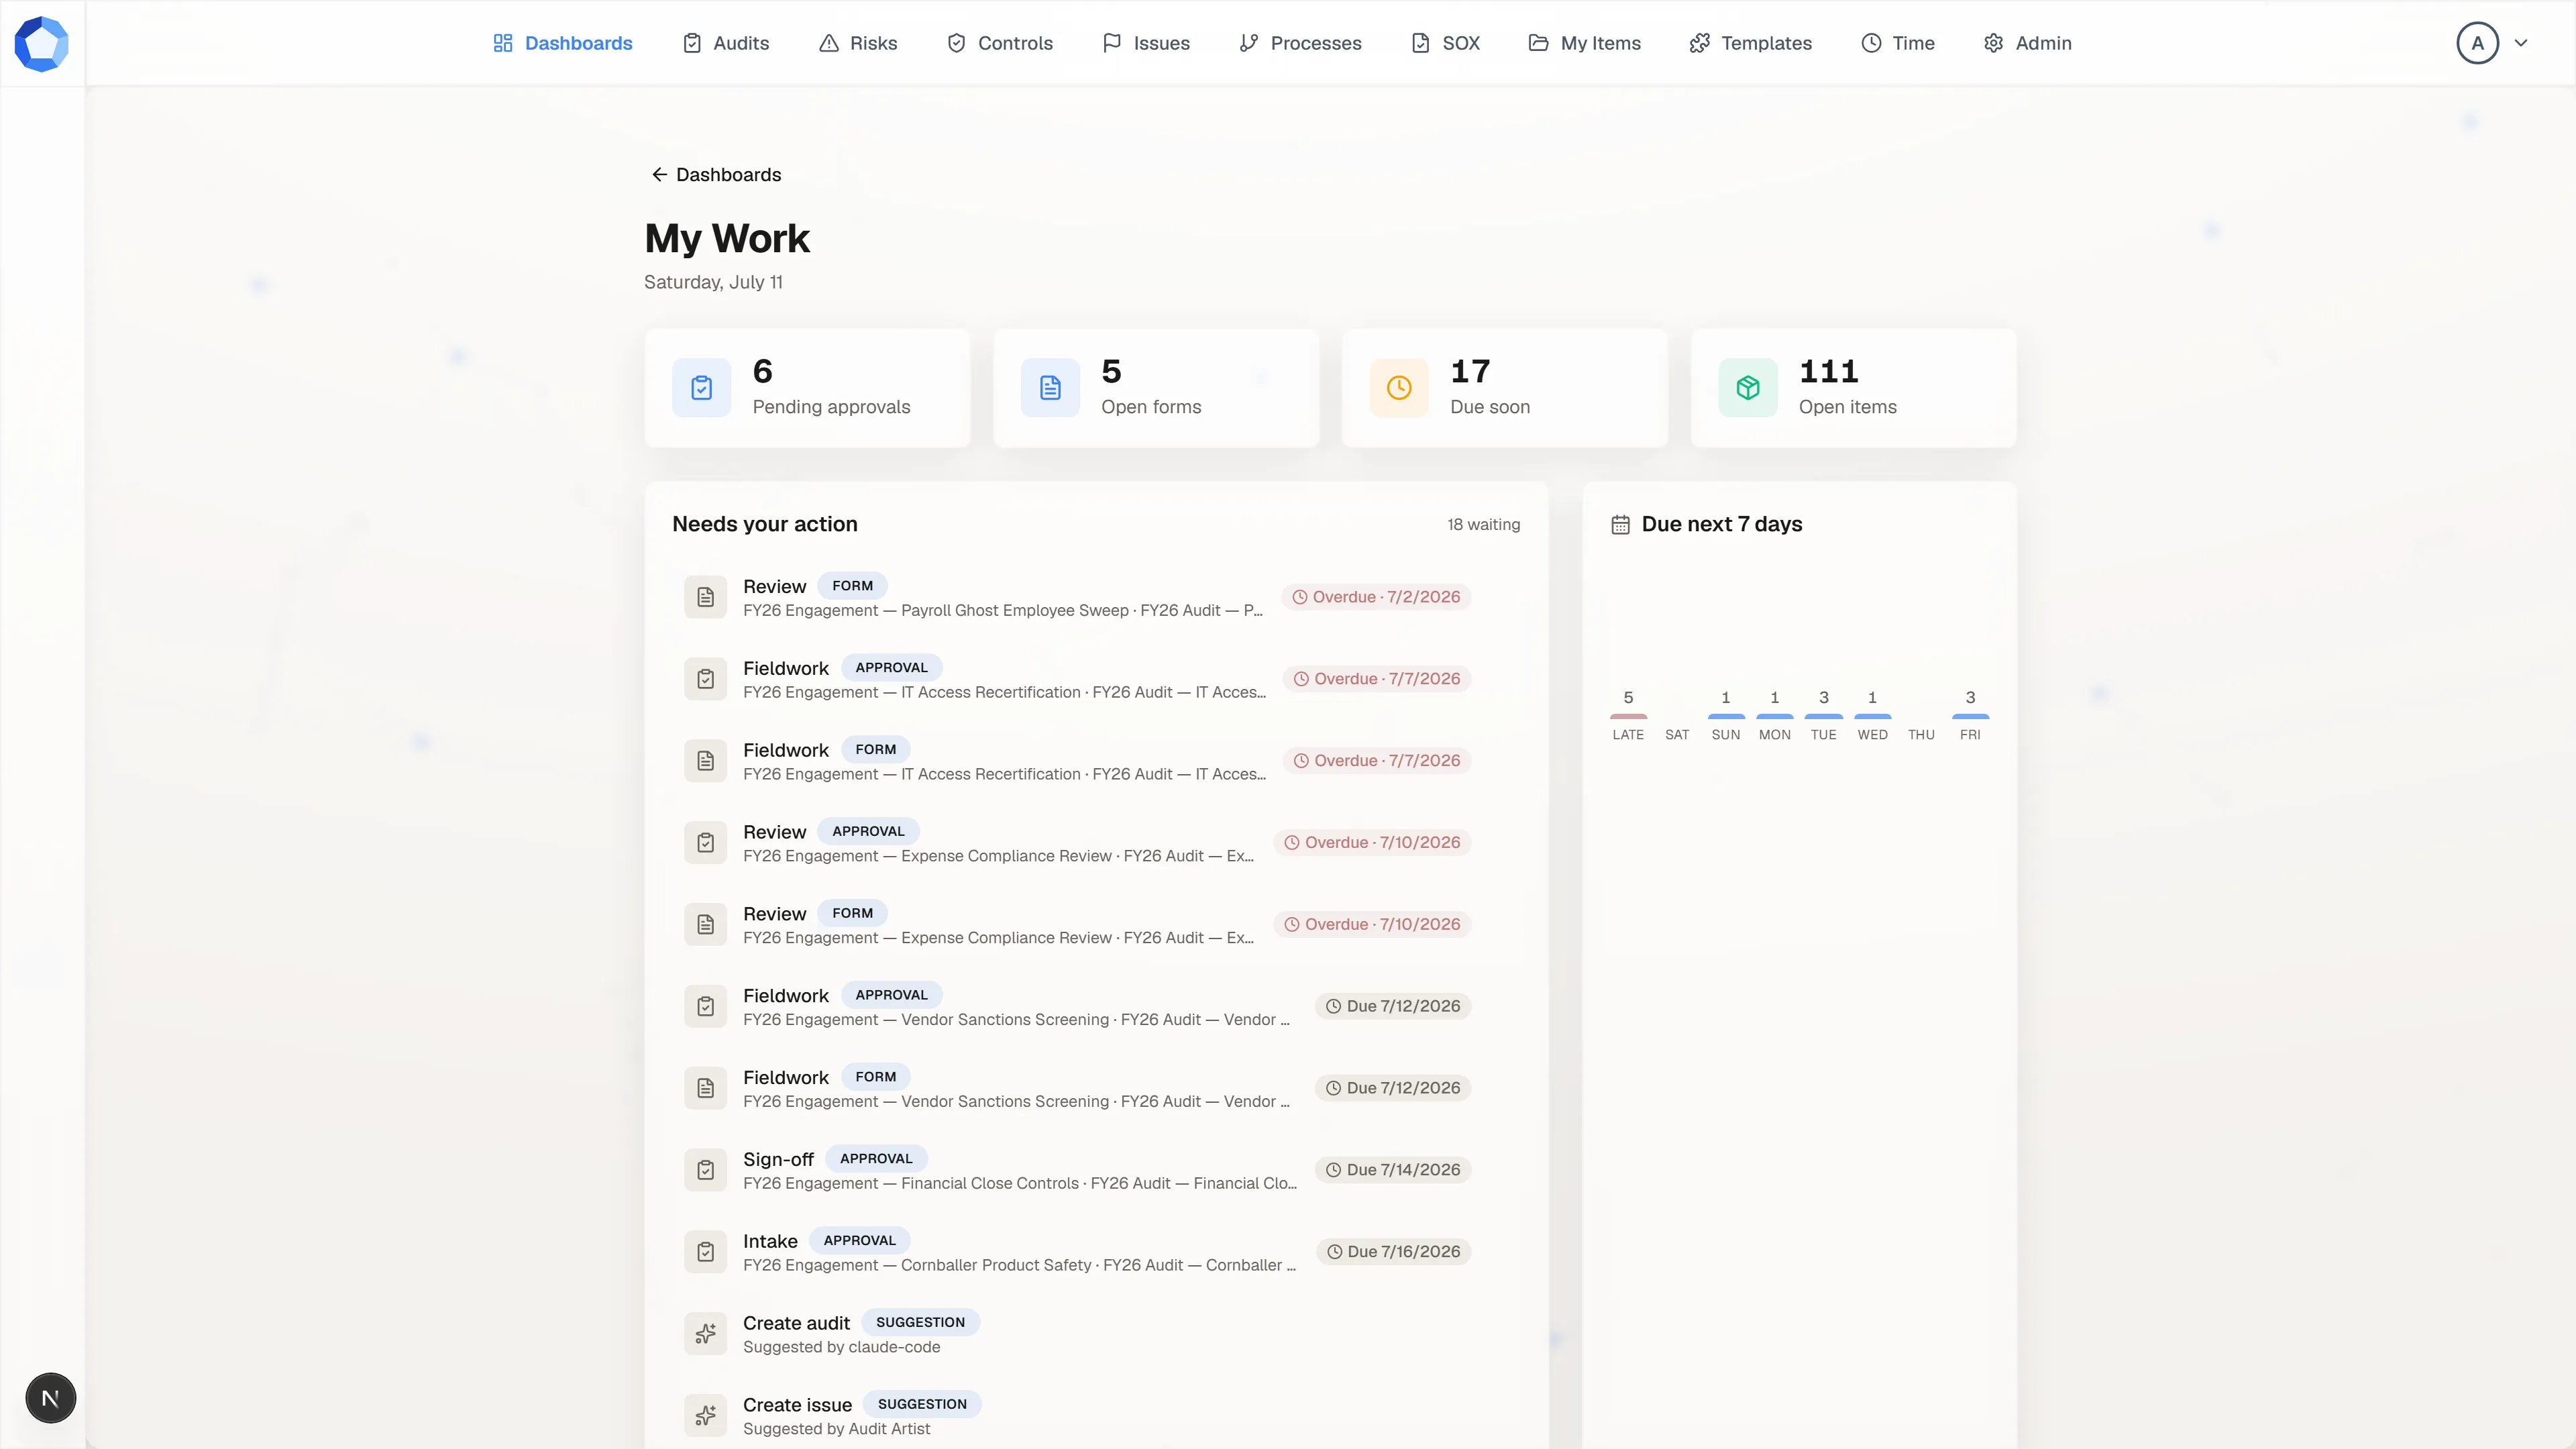
Section titled “Read the numbers, then the list”My Work is the one to start from: tiles across the top count your pending approvals, open forms, items due soon, and open items, and the list below them, Needs your action, spells out each one with what it is, what it belongs to, and when it was due.
Tiles summarize. Lists are where you act: select a row and you land on the step, form, or record behind it.
Find where work is stuck
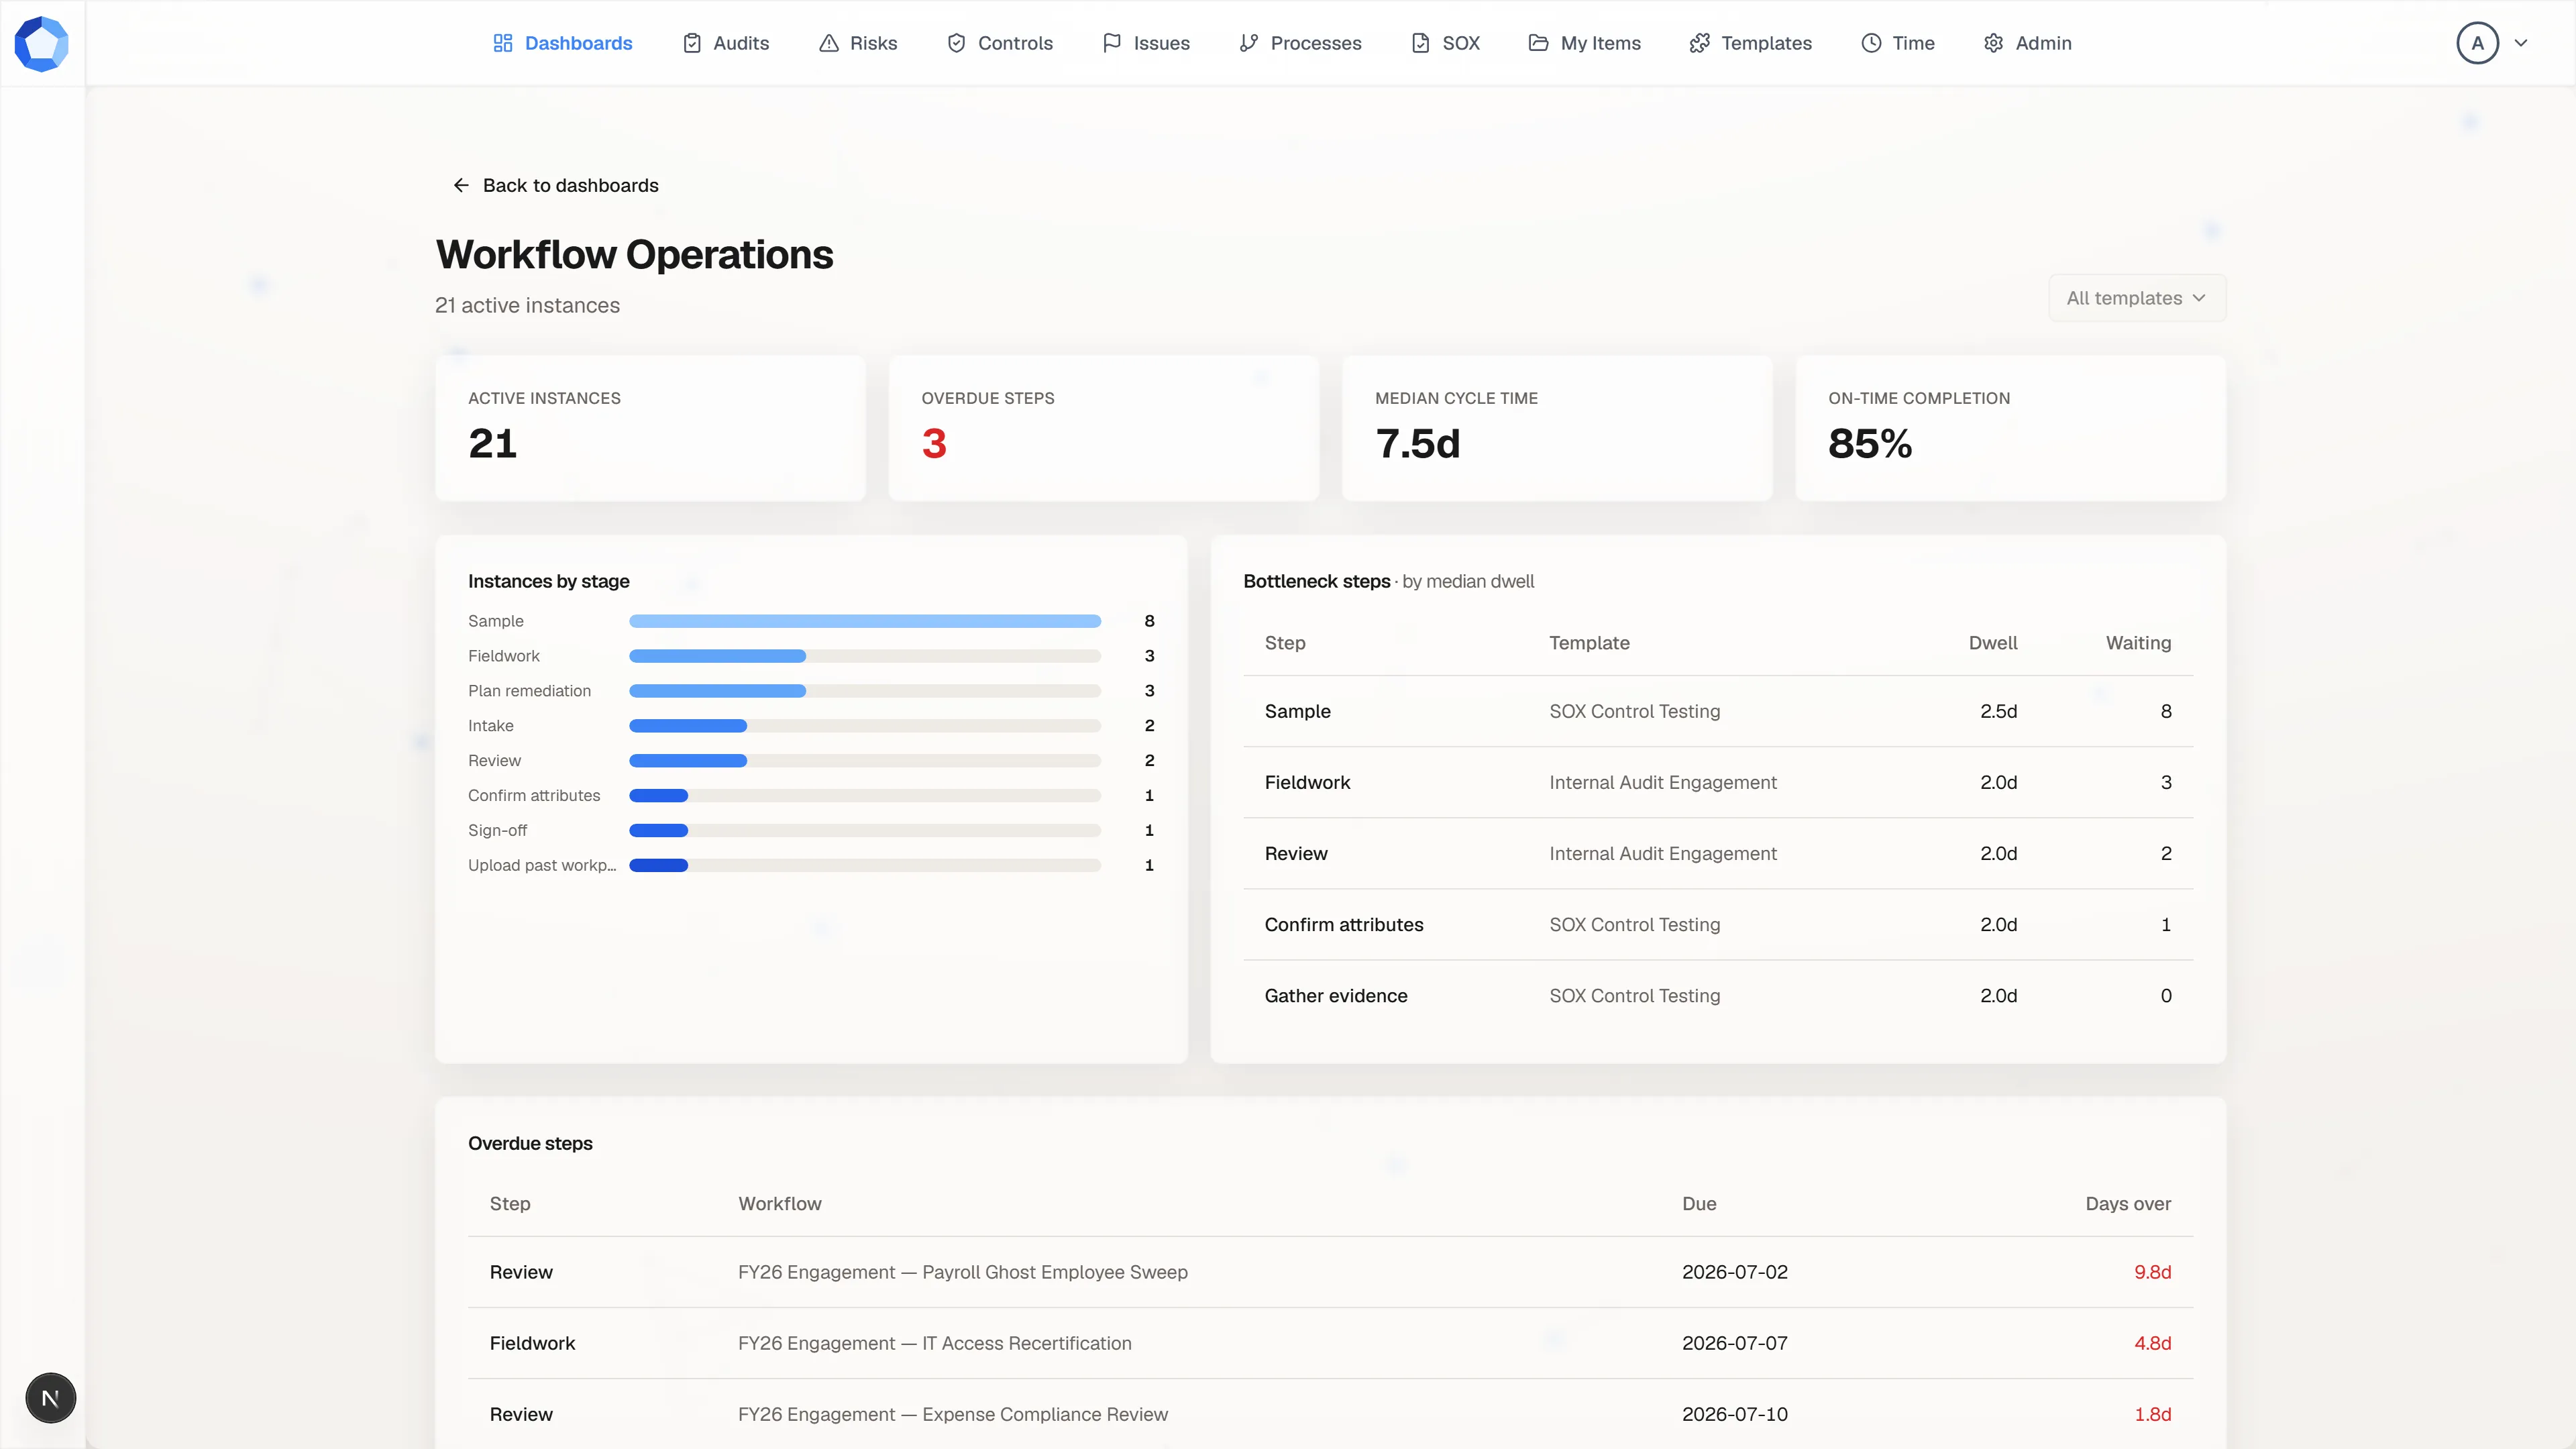
Section titled “Find where work is stuck”Workflow Operations answers the operational question: of everything running, what is not moving. It counts active instances, overdue steps, median cycle time, and on-time completion, then breaks instances down by stage and ranks Bottleneck steps by how long work sits there and how many runs are waiting.
Beneath that, an overdue table names each late step, its workflow, its due date, and how many days over it is. Filter the whole page to one template to compare one process against itself over time.
Watch what the agents are doing
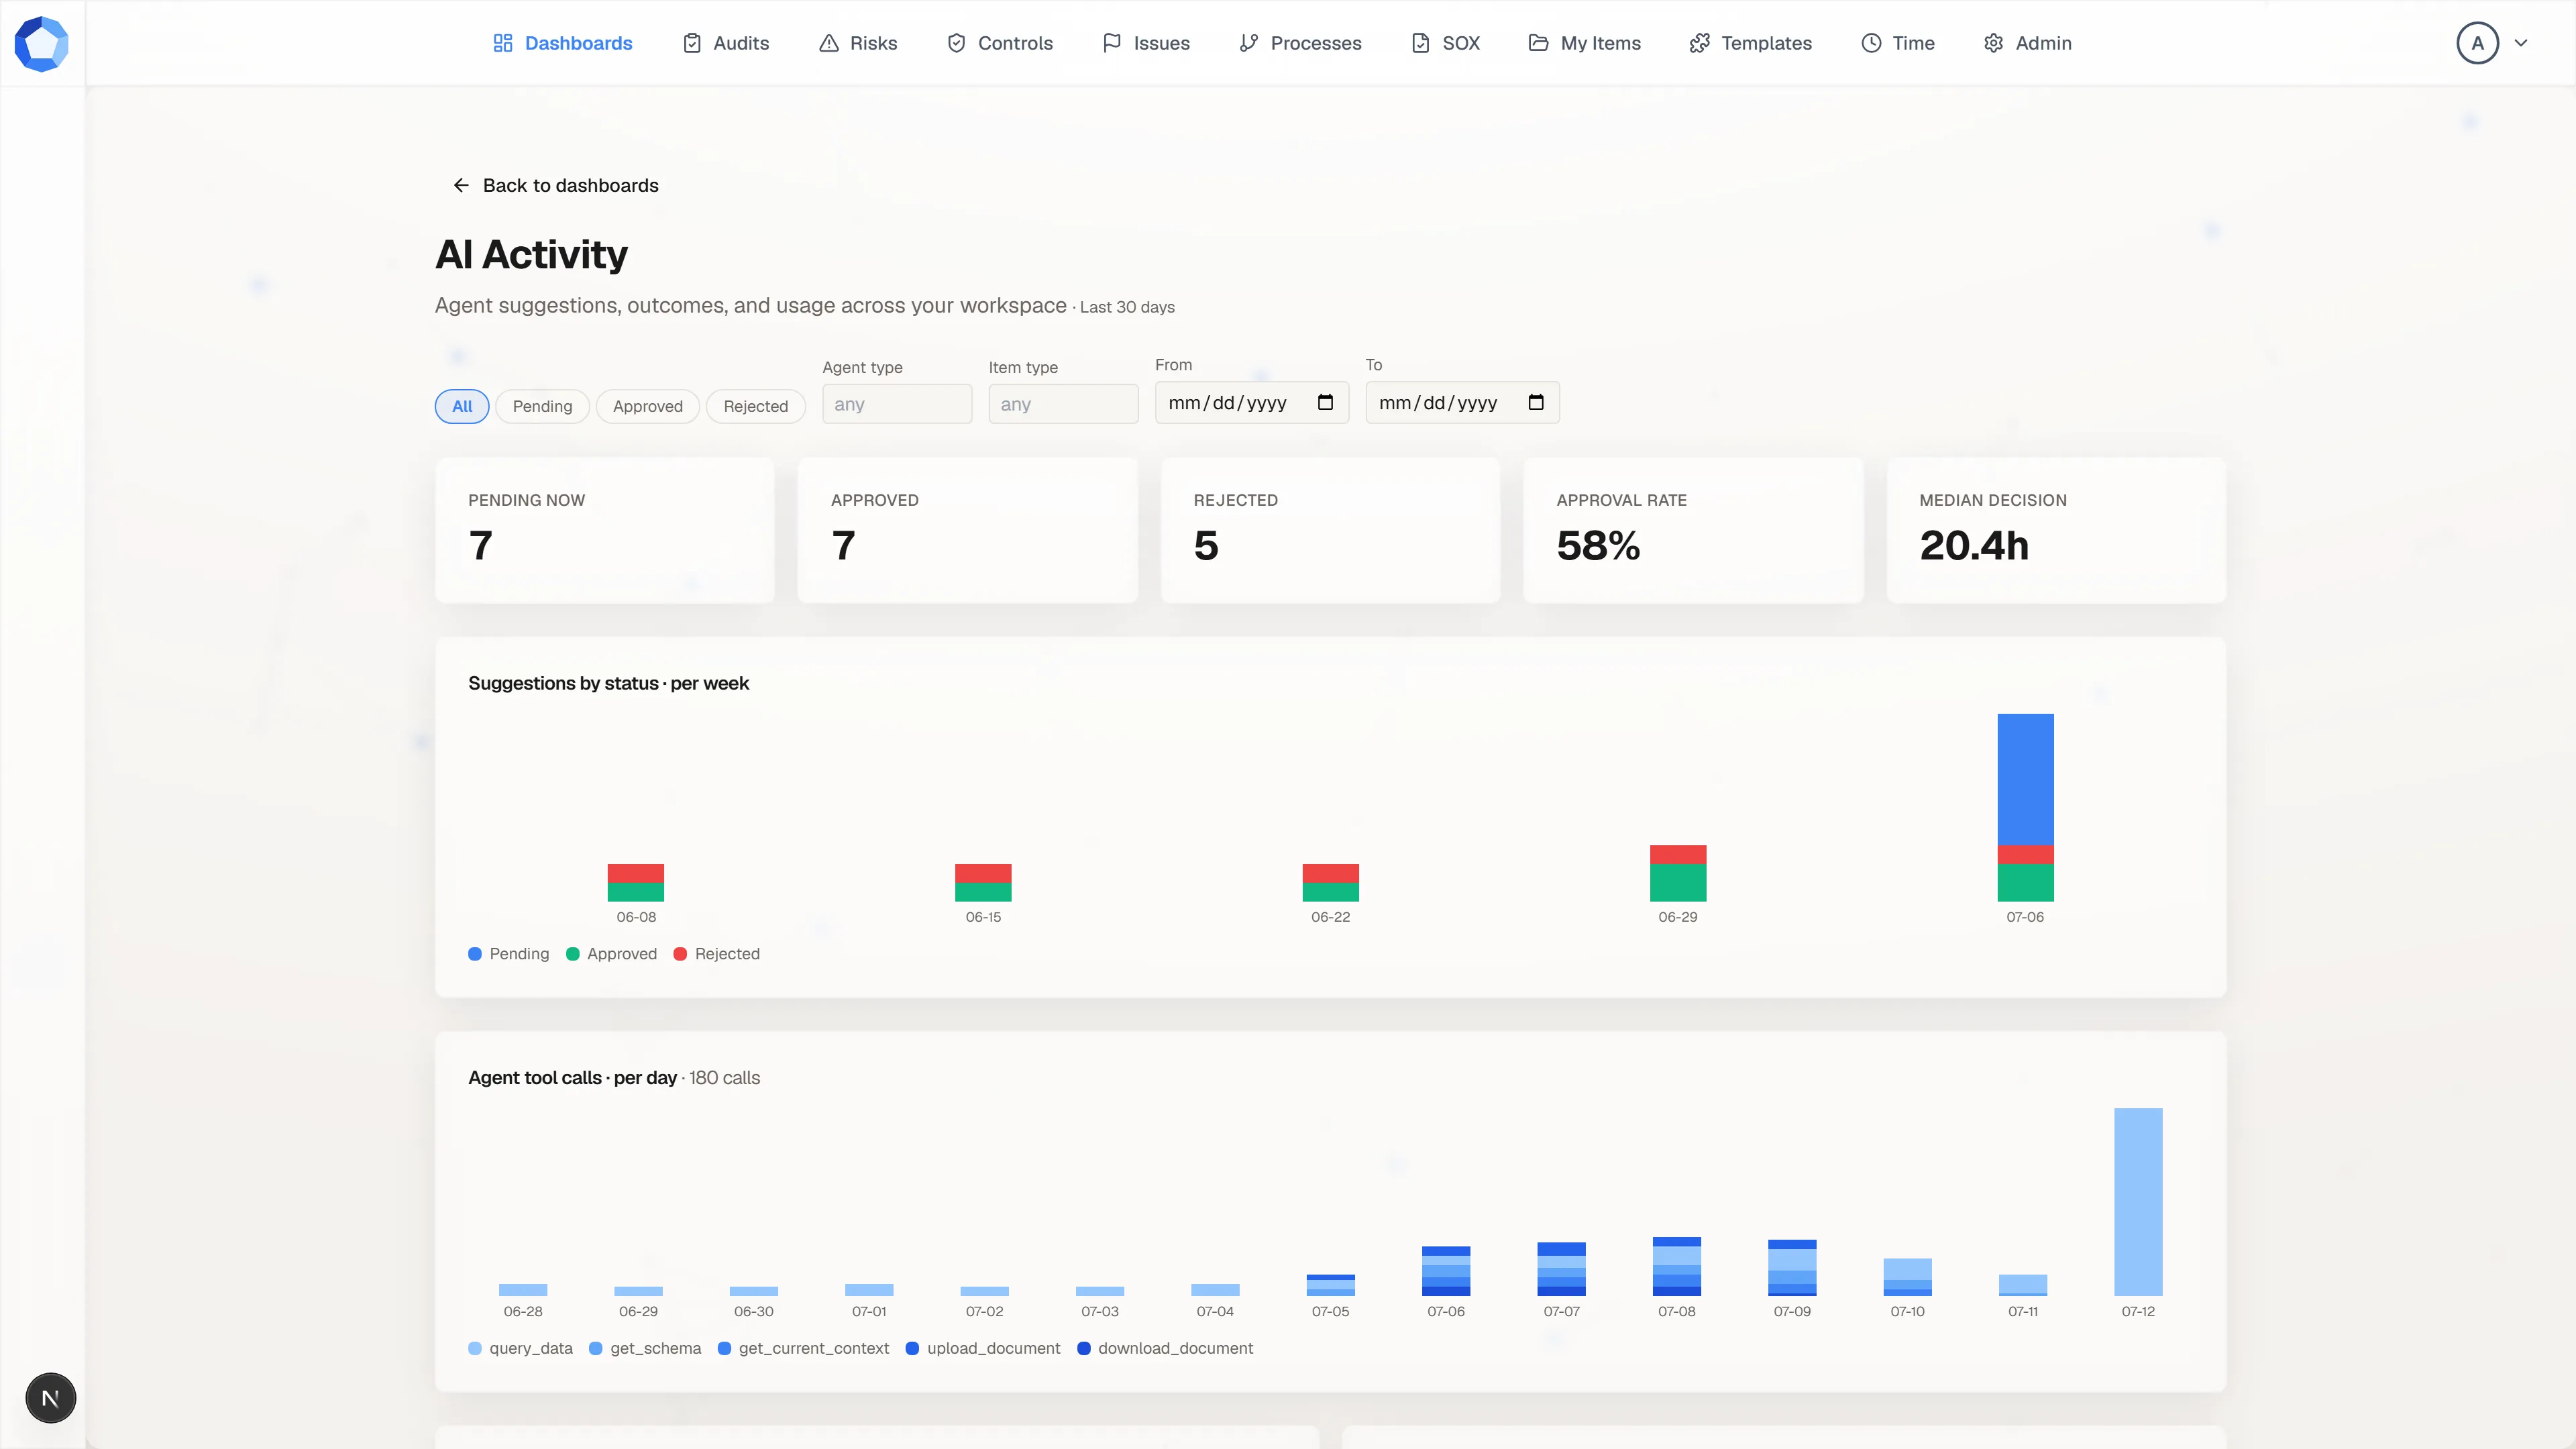
Section titled “Watch what the agents are doing”AI Activity measures the agent side of the tenant: how many suggestions are pending now, how many were approved, how many rejected, the resulting approval rate, and the median time people take to decide. The chart plots suggestions by status over time, and a second chart plots agent tool calls per day.
Filter it by status, agent, item type, or date range. A rising rejection rate is a signal to tighten the instructions an agent is working from.
The dashboards you start with
Section titled “The dashboards you start with”Every tenant gets a set of built-in dashboards, reachable from the gallery like any other:
| Dashboard | What it answers |
|---|---|
| My Work | What is waiting on me right now. |
| Open Requests | What I sent out that has not come back. |
| Form Follow-up | Which forms are outstanding, overdue, or returned. |
| Workflow Operations | Where running work is stuck. |
| Capacity Monitoring | Who is carrying how much open work. |
| AI Activity | What agents proposed, and what people decided. |
| Timeline | What changed across every item type, in order. |
| Universe | How everything connects. |
The operational pages are always there: before any workflow is running they show an empty state rather than disappearing.
On top of those, posture and register pages appear as your tenant’s schema grows: an executive summary and an operational overview, a register for each of the control, risk, issue, audit, policy, and system item types your tenant has active, and a SOX matrix once your controls carry a SOX applicability field. Administrators can also import dashboards or build their own, so your gallery is usually longer than this list.
Reading any dashboard
Section titled “Reading any dashboard”The widget vocabulary is small and repeats everywhere:
| Widget | What to do with it |
|---|---|
| Stat tile or stat row | Read the number, then find the list that explains it. |
| Chart | Compare across time, status, or owner. |
| Table | The records themselves: this is where you drill through. |
| Filter bar | Narrows every other widget on the page at once. |
Filters apply to the whole page, not just the widget you set them on, so a dashboard that looks empty is often a filter left over from your last visit.
Your own dashboards, and who sees them
Section titled “Your own dashboards, and who sees them”A dashboard you create is PRIVATE by default: only you see it. Set it to
PUBLIC and everyone in the tenant can, though page access still governs who
can reach the Dashboards section at all. Favorite the ones you use to keep them
at the front of the gallery.
Dashboards read; they do not write. Nothing you do on one changes a record. To change something, follow the link through to the item, step, or form and work it there.
When an agent proposes a dashboard
Section titled “When an agent proposes a dashboard”An agent can propose a dashboard through suggest_change. It arrives as a preview of the real thing, with the instruction the agent was given, and two controls: Approve & Create to keep it, Reject to discard it. It does not exist in your gallery until you approve it.